
Measure Hiring Efficiency Enterprise Metrics: RecOps Playbook

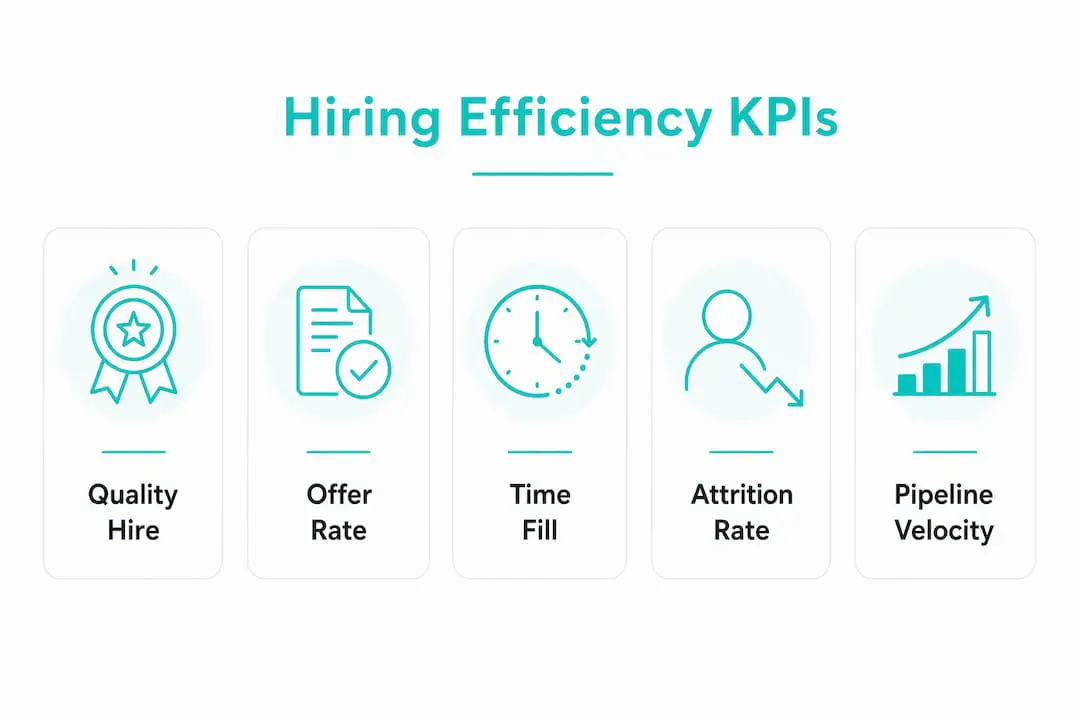
To measure hiring efficiency at enterprise scale, five outcome-based QBR metrics define what matters: Quality of Hire, Offer Acceptance Rate, Time to Fill, First-Year Attrition, and Pipeline Velocity. Everything else is supporting data.
- Quality of Hire: Connects TA decisions to long-term performance and retention; the metric your CHRO and business leaders actually care about.
- Offer Acceptance Rate: Signals compensation competitiveness and candidate experience; a rate below 70% typically indicates a structural problem.
- Time to Fill: Measures requisition approval to accepted offer; the number your CFO uses to assess revenue-capacity risk.
- First-Year Attrition: Reveals whether hiring quality holds up post-onboarding; directly tied to productivity loss and replacement cost.
- Pipeline Velocity: Tracks how fast qualified candidates move through stages; a leading indicator of future Time to Fill.
Review these five monthly at the operational level and quarterly in a formal QBR. Data ownership sits across three systems: your ATS (speed and funnel data), your AI assessment platform (quality signals), and your HRIS (post-hire outcomes).
Table of Contents
- What does “hiring efficiency” actually mean for enterprise RecOps?
- The five QBR-ready KPIs: formulas, sources, and benchmarks
- Which operational metrics help you diagnose where time is lost?
- How do you build a working measurement system from these KPIs?
- How do AI-powered skill assessments change what you measure?
- How do you set defensible targets and benchmark progress?
- What measurement pitfalls should RecOps teams avoid?
- What does a 30/60/90-day implementation look like?
- Key Takeaways
- The metrics that actually move the needle
- Talent Approved gives your assessments a direct line to QBR metrics
- Useful sources and further reading
- FAQ
What does “hiring efficiency” actually mean for enterprise RecOps?
Hiring efficiency, from a RecOps perspective, means your system reliably produces quality hires at a predictable speed. It is not just about moving fast. A team that fills roles in 20 days but loses 40% of those hires within 12 months is not efficient — it is expensive.
The most common definitional confusion is between Time to Hire and Time to Fill. They measure different things for different audiences.
| Metric | Start Point | End Point | Primary Audience |
|---|---|---|---|
| Time to Fill | Requisition approval | Accepted offer | CFO, RevOps, business leaders |
| Time to Hire | Candidate application | Accepted offer | Recruiting team, hiring managers |
A structured prioritization framework for recruitment metrics separates efficiency metrics (speed, cost, funnel conversion) from outcome metrics (quality, retention, performance). Both matter, but they answer different questions:
- Efficiency metrics tell you how the process is running: scheduling lead time, screening pass rate, interview-to-offer ratio.
- Outcome metrics tell you whether the process is working: Quality of Hire, First-Year Attrition, Offer Acceptance Rate.
Five to seven well-chosen metrics tracked consistently outperform sprawling dashboards. Before adding any metric, define the specific decision it will influence.
The five QBR-ready KPIs: formulas, sources, and benchmarks
Each KPI below includes its calculation, the system that owns the data, and the RecOps team member responsible for it. For a deeper look at enterprise recruiting KPIs, Talent Approved’s resource library covers dashboard design and definition templates.

| KPI | Formula | Primary Data Source | RecOps Owner |
|---|---|---|---|
| Quality of Hire | (Performance % + Retention % + Manager Satisfaction %) / 3 | HRIS + Performance system + Survey | TA Lead |
| Offer Acceptance Rate | Accepted offers / Total offers × 100 | ATS offer module | Recruiting Ops |
| Time to Fill | Date offer accepted − Date requisition approved | ATS requisition events | Recruiting Ops |
| First-Year Attrition | Separations within 12 months / Total hires × 100 | HRIS termination records | HR Analytics |
| Pipeline Velocity | Qualified candidates advancing per stage per week | ATS stage-movement events | TA Lead |
Quality of Hire is the composite metric that connects TA to business outcomes. Measure it at 90 days (manager satisfaction), 6 months (performance rating), and 12 months (retention). Normalize each component to a 0–100 scale, then average them.
Offer Acceptance Rate benchmarks sit at 82%–87% globally. Below 70% signals a compensation, brand, or candidate-experience problem that needs a specific corrective action, not just monitoring.
Time to Fill enterprise benchmarks typically run 30–45 days depending on role family. Technical roles trend longer; high-volume sales roles shorter.
First-Year Attrition at or below 15% is a reasonable enterprise target. Above that threshold, the cost compounds quickly through replacement recruiting and lost productivity.
Pipeline Velocity has no universal benchmark — set it by role family and compare quarter-over-quarter within your own data.
Pro Tip: Structured interviews with standardized scorecards are substantially more predictive than unstructured conversations. Use them to generate consistent Quality of Hire inputs across hiring managers.
Which operational metrics help you diagnose where time is lost?
The five QBR metrics tell you what is happening. Operational metrics tell you where to fix it. These are the funnel and process indicators that explain KPI movement.
- Screening pass rate: Percentage of applicants who clear initial screening; a sudden drop signals sourcing quality or job-description drift.
- Assessment completion rate: Percentage of invited candidates who finish the skill assessment; low rates often indicate friction in the candidate experience.
- Interview-to-offer ratio: How many interviews it takes to generate one offer; enterprise benchmark sits at a 72.2% interview-to-offer conversion rate.
- Scheduling lead time: Days between interview request and confirmed interview slot.
- Review-to-decision time: Days from final interview to offer extended; often where approvals stall.
Automated scheduling confirms interviews 26% faster than manual scheduling, cutting median scheduling time from roughly 5 hours to 3.7 hours. Across a multi-stage interview loop, that compounds into days saved on every requisition. Scheduling is one of the most controllable levers for improving Time to Fill, particularly in complex, multi-interviewer processes.
How do you build a working measurement system from these KPIs?
Turning KPIs into a live dashboard requires clean data from three integrated sources: your ATS, your AI assessment platform, and your HRIS.
Minimal fields to capture per system:
- ATS: Requisition open date, stage-entry timestamps, offer date, offer outcome, source channel.
- AI assessment platform: Assessment sent date, completion date, competency scores, proctoring flags, AI summary rating.
- HRIS: Hire date, 90-day manager rating, 6-month performance score, separation date and reason.
Integration checklist:
- Configure webhooks or scheduled ETL pulls between ATS and BI tool (Power BI or Tableau work well for this).
- Map offer stages carefully — many ATS platforms have multiple “offer” statuses that inflate or deflate Time to Fill if not normalized.
- Use a single requisition ID as the join key across systems; duplicate IDs are the most common mapping failure.
- Capture assessment completion timestamps at the candidate level, not the batch level.
Dashboard design: One QBR summary page showing the five KPIs with trend arrows, a funnel view from requisition to accepted offer with stage conversion rates, and cohort filters by role family, region, and source channel. Operational teams get a second page with the diagnostic metrics above.
Cadence: Monthly operational reviews for the funnel and process metrics; quarterly QBR with a one-page executive summary focused on the five outcome KPIs and their financial translation.
Pro Tip: Translate Time to Fill reductions into vacancy savings on your QBR one-pager: multiply days saved by the role’s daily vacancy cost. That single line earns more leadership attention than any funnel chart.
How do AI-powered skill assessments change what you measure?
AI assessments add a layer of signal that traditional screening cannot produce. Beyond a pass/fail screen, they generate competency scores by dimension, time-on-task data, question-level difficulty calibration, proctoring flags, and AI-generated performance summaries.
These data points feed your KPIs directly:
- Competency scores → Quality of Hire: Correlate early assessment scores with 90-day manager ratings to validate predictive accuracy before weighting them in your QoH formula.
- Completion rate → Pipeline Velocity: A low assessment completion rate stalls the pipeline upstream; fixing it often recovers more velocity than any downstream change.
- Proctoring flags → Assessment integrity: Flag rates feed your governance log and inform whether a score should be included in QoH calculations.
Validation checklist before baking assessment scores into hiring decisions:
- Run a pilot cohort of at least 30 completed assessments per role family.
- Correlate assessment scores with 90-day manager ratings and time-to-productivity.
- Check for adverse impact across demographic groups (EEOC-relevant analysis).
- Document construct validity: does the assessment measure what the role actually requires?
- Set a minimum sample-size threshold (typically 50+ hires per cohort) before drawing structural conclusions.
Talent Approved’s AI test generator builds role-specific assessments from a job description in minutes, with built-in anti-cheat screen and webcam monitoring that generates proctoring flags automatically. The AI-generated summaries feed directly into your candidate records, reducing review time per candidate.
Pro Tip: Retain assessment session data and proctoring logs for a minimum of one year. This supports both EEOC audit readiness and ongoing predictive validity analysis.
How do you set defensible targets and benchmark progress?
Benchmarking works best when you cohort by role family and source channel, not across the entire organization at once.
Example target ranges for enterprise teams:
- Quality of Hire: target composite score of 75+ on a 0–100 scale; flag any cohort below 65 for root-cause review.
- Offer Acceptance Rate: target 80%+; segment by hiring manager and location to find where declines cluster.
- Time to Fill: set targets by role family (e.g., 35 days for technical roles, 28 days for sales).
- First-Year Attrition: target 15% or below; track separately for referral vs. inbound sources.
- Pipeline Velocity: set a baseline in Q1, then target 10%–15% improvement quarter-over-quarter.
Worked financial example: If a role carries a daily vacancy cost of $800 and your Time to Fill drops from 42 days to 35 days, the vacancy savings per hire equal $5,600. Across 50 hires per quarter, that is $280,000 in recovered capacity value — a figure that belongs on every QBR one-pager.
For improving Quality of Hire over time, cohort analysis by source channel is the fastest way to find which pipelines produce durable hires. Referral hires consistently outperform job-board hires on retention and manager satisfaction across most enterprise datasets.
Interpret short-term volatility carefully. A single quarter with elevated attrition in one role family is not a structural signal — it requires at least two consecutive quarters and a minimum cohort of 30 hires before adjusting targets or processes.
What measurement pitfalls should RecOps teams avoid?
The most common failure mode is metric sprawl: tracking 20 metrics because they are available, not because each one drives a decision. Recruiting analytics should focus on five to seven well-chosen metrics tracked consistently.
- Mis-specified denominators: Offer Acceptance Rate calculated on all offers (including verbal) vs. written offers only will produce different numbers. Define the denominator in writing and lock it.
- Small-sample overinterpretation: A 50% First-Year Attrition rate in a cohort of four hires is noise, not a trend.
- Conflating efficiency with quality: Cutting Time to Fill by rushing assessments or skipping structured interviews typically raises First-Year Attrition within two quarters.
Governance checklist:
- Assign a single metric owner for each KPI.
- Maintain a definition document with formula, denominator, data source, and last-updated date.
- Use change control: any formula change requires sign-off and a note in the dashboard changelog.
- Retain audit trails for assessment scoring, especially when AI-generated scores influence hiring decisions.
Privacy and fairness: Retain only the PII necessary for metric calculation. Document your AI model’s validation methodology and maintain human-in-the-loop review for all final hiring decisions. Under EEOC guidelines, any assessment used in hiring must be validated for job-relatedness and must not produce adverse impact on protected groups. Review your assessment data for disparate impact at least annually.
Pro Tip: Candidate experience degrades when assessment friction is high. Monitor assessment completion rates as an early warning signal — a drop of more than 10 percentage points often precedes a decline in Offer Acceptance Rate.
What does a 30/60/90-day implementation look like?
A structured sprint plan keeps the measurement rollout from stalling in data-mapping debates.
Days 1–30: Define and pilot
- Finalize KPI definitions and denominators with sign-off from TA, HR Analytics, and Finance.
- Map required data fields to their source systems (ATS, assessment platform, HRIS).
- Run pilot extracts for one role family; validate that field values match expected ranges.
- Identify integration gaps (missing webhooks, unstandardized offer stages).
Days 31–60: Build and validate
- Build ETL pipelines and connect to your BI tool.
- Correlate assessment scores with 90-day manager ratings for the pilot cohort.
- Iterate dashboard UX with two or three hiring managers; confirm the funnel view is readable.
- Run a dry-run QBR one-pager with the pilot data.
Days 61–90: Roll out and present
- Expand dashboards to all role families.
- Set formal targets for each KPI by role family and region.
- Deliver the first live QBR one-pager with trend arrows, financial translations, and action items with named owners.
- Schedule monthly operational reviews and quarterly QBR cadence going forward.
Pro Tip: Prioritize scheduling automation in the Day 1–30 sprint. It is the fastest single lever for reducing Time to Fill and generates immediate, visible results that build stakeholder confidence in the broader measurement program.
Key Takeaways
Enterprise hiring efficiency is defined by five outcome metrics — Quality of Hire, Offer Acceptance Rate, Time to Fill, First-Year Attrition, and Pipeline Velocity — reviewed monthly operationally and quarterly in a formal QBR.
| Point | Details |
|---|---|
| Five QBR metrics only | Focus on Quality of Hire, Offer Acceptance Rate, Time to Fill, First-Year Attrition, and Pipeline Velocity; everything else is supporting data. |
| Scheduling automation saves 26% | Automated scheduling cuts median scheduling time from ~5 hours to ~3.7 hours, compounding savings across multi-stage loops. |
| Translate metrics to dollars | Multiply days saved on Time to Fill by daily vacancy cost to produce a vacancy savings figure for QBR one-pagers. |
| Validate AI assessment scores | Correlate assessment scores with 90-day manager ratings across a minimum cohort before weighting them in Quality of Hire calculations. |
| Talent Approved as the assessment layer | Talent Approved’s AI test generator and anti-cheat proctoring produce the competency scores and completion data that feed Quality of Hire and Pipeline Velocity directly. |
The metrics that actually move the needle
Most RecOps teams underestimate how much of their Time to Fill problem lives upstream, in scheduling delays and unstructured screening, rather than in the interview itself. The data is clear: automating scheduling alone cuts confirmation time by 26%. That is not a marginal gain — across 200 requisitions a year, it is weeks of recovered capacity.
The deeper issue is that quality and speed are treated as a trade-off when they do not have to be. A well-designed AI assessment, validated against 90-day performance data, does both: it screens faster and it screens better. The teams that figure this out stop defending Time to Fill in QBRs and start showing Quality of Hire trends instead. That shift changes how finance and RevOps view the recruiting function entirely.
The five-metric framework works because it forces a decision: every metric on your QBR must connect to a business outcome or it does not belong there. Vacancy savings, retention-adjusted ROI, revenue per rep — these are the translations that earn budget and credibility. Numbers that stay inside the ATS never change anything.
Talent Approved gives your assessments a direct line to QBR metrics
Your QBR metrics are only as good as the data feeding them. Talent Approved’s AI skill assessment platform generates role-specific tests from a job description in minutes, delivers competency scores at the candidate level, and produces AI-generated summaries that reduce per-candidate review time. Anti-cheat screen and webcam monitoring creates proctoring flags automatically, so your assessment completion and integrity data is always audit-ready.
Every completed assessment feeds structured, comparable data into your ATS candidate record — the exact inputs your Quality of Hire formula and Pipeline Velocity tracking need. No subscription required: Talent Approved charges $5 per completed candidate assessment, so you pay for results, not seats. Build your first assessment and connect it to your QBR metrics at talentapproved.com.
Useful sources and further reading
External research used in this article:
- Recruiting Operations Benchmarks | 2026 Talent Trends Report — Ashby: scheduling automation benchmarks and Time to Hire analysis.
- Recruiting Metrics: The Complete 2026 Guide — Talentprise: five-metric QBR framework and financial translation guidance.
- How to Measure Quality of Hire: Metrics That Matter — Qureos: Quality of Hire formula and structured interview research.
- Identifying the most effective recruitment metrics using AHP — Future Business Journal: metric prioritization framework for IT organizations.
- The Five Recruiting Benchmarks Worth Defending in Your QBR — Talent Acquisition Strategy: QBR framing and Time to Fill vs. Time to Hire distinction.
Recommended Talent Approved articles:
- Enterprise Recruiting KPIs to Track for HR Success
- How Hiring Accuracy Is Measured: A Guide for HR Teams
- Recruiter Efficiency Metrics: A 2026 HR Guide
- Hiring Process Efficiency: A 2026 Guide for HR Teams
FAQ
What are the five QBR-ready hiring efficiency metrics?
The five are Quality of Hire, Offer Acceptance Rate, Time to Fill, First-Year Attrition, and Pipeline Velocity. These connect directly to business outcomes and are the only metrics that belong at the center of a recruiting QBR.
What is the difference between Time to Fill and Time to Hire?
Time to Fill starts at requisition approval and ends at accepted offer, making it the metric finance and RevOps use to assess capacity risk. Time to Hire starts at candidate application and is an internal operational lever for the recruiting team.
How should AI assessment scores feed into Quality of Hire?
Correlate assessment scores with 90-day manager ratings across a minimum pilot cohort before including them in your Quality of Hire formula. Talent Approved’s AI-generated summaries and competency scores are structured for exactly this type of post-hire validation.
How often should enterprise teams review hiring efficiency metrics?
Review operational metrics (screening pass rate, scheduling lead time, assessment completion rate) monthly. Present the five outcome KPIs in a formal QBR quarterly, with financial translations such as vacancy savings and retention-adjusted ROI.
What is a reasonable enterprise target for Offer Acceptance Rate?
Target 80% or above. A rate below 70% typically signals a compensation, employer brand, or candidate-experience issue that requires a specific corrective action rather than continued monitoring.