
Enterprise Recruiting KPIs to Track for HR Success

Enterprise recruiting KPIs to track are the quantifiable metrics that measure hiring effectiveness and connect talent acquisition to business outcomes. The term “recruiting KPIs” is the standard industry label; “talent acquisition metrics” is the formal equivalent used in HR analytics frameworks. The right set of KPIs tells you whether your hiring process produces quality employees, controls costs, and supports organizational growth. Quality of hire and long-term fit are the most impactful recruiting KPIs, yet many enterprises measure only easy metrics like hires or cost-per-hire. Tracking the wrong numbers wastes time and produces no useful insight for your leadership team.
1. What are the top enterprise recruiting KPIs to track?
The ten KPIs listed here cover both efficiency and quality outcomes across the full hiring lifecycle.
Time-to-fill
Time-to-fill measures the number of days from when a job opens to when a candidate accepts an offer. Enterprise benchmarks typically run 45–65 days depending on role complexity and industry. Longer time-to-fill directly increases vacancy cost, which makes this metric a financial argument, not just a process one.

Cost-per-hire
Cost-per-hire adds all internal and external recruiting costs, then divides by total hires in a period. It captures sourcing fees, recruiter salaries, job board spend, and assessment costs. Tracking it over time reveals whether your process is becoming more or less efficient.
Quality of hire
Quality of hire measures how well a new employee performs and fits the role after 6–12 months. It typically combines performance ratings, manager satisfaction scores, and ramp-up time. This is the KPI most directly tied to business value, yet it requires cross-functional data from both your ATS and your performance management system.
Pro Tip: Use Talent Approved’s AI-generated candidate summaries to capture pre-hire skill data. Comparing that data to post-hire performance scores gives you a clean quality-of-hire calculation without manual tracking.
Offer acceptance rate
Offer acceptance rate typically clusters in the 75–85% range. Rates below 75% often signal compensation gaps or a poor candidate experience late in the process. Tracking this metric by department or role type reveals where your offers are losing ground.
Candidate NPS
Candidate Net Promoter Score measures how likely candidates are to recommend your hiring process to others. Candidate NPS scores above +50 are strong indicators of positive candidate experience and employer branding efficiency. A low score here predicts sourcing problems before they appear in your pipeline volume.
First-year attrition rate
First-year attrition measures the percentage of new hires who leave within 12 months. High first-year attrition signals a mismatch between what candidates expected and what the role delivered. This KPI connects recruiting directly to retention costs and is one of the clearest signs that your screening process needs adjustment.
Applicants per opening
Applicants per opening tracks how many candidates apply for each role. Organizations using best-of-breed talent acquisition systems achieve 49% higher applicant-per-opening rates than standard systems. Higher volume gives you more selection power, but only if your screening process can handle it without sacrificing quality.
Interview-to-offer ratio
Interview-to-offer ratio shows how many candidates you interview for every offer extended. A high ratio means your screening is inefficient or your job criteria are unclear. A ratio above 5:1 typically indicates a process problem worth investigating.
Source-to-hire conversion
Source-to-hire conversion tracks which sourcing channels produce the most hires relative to the candidates they generate. LinkedIn, employee referrals, job boards, and direct outreach each perform differently by role type. Knowing your conversion rate by source lets you reallocate budget toward channels that actually produce hires.
Recruitment ROI
Recruitment ROI compares the financial value of hires to the total cost of acquiring them. It requires translating quality-of-hire data into productivity or revenue contribution estimates. This is the KPI that earns budget approval from finance and the C-suite.
How to measure and interpret recruiting KPIs in an enterprise setting
Measuring KPIs well requires more than pulling numbers from your ATS. The process below gives you a reliable framework.
-
Start with business decisions, not metrics. Recruiters should select KPIs based on the 3–5 key business decisions they need to inform. This prevents metrics sprawl and keeps your dashboard focused on what actually matters.
-
Separate activity metrics from outcome metrics. Most enterprise TA teams confuse activity metrics like number of interviews with outcome metrics like quality of hire. Activity metrics describe what your team did. Outcome metrics describe whether it worked.
-
Integrate your data sources. Cross-functional data integration between your ATS, HRIS, and performance systems is essential for connecting KPIs to actual employee success. Without this integration, your quality-of-hire and first-year attrition numbers are guesses.
-
Translate KPIs into financial terms. Time-to-fill should be translated into vacancy cost impact using the formula: time-to-fill multiplied by daily vacancy cost. This turns a process metric into a budget conversation your CFO will understand.
-
Start simple, then scale your tools. Most recruiting dashboards can be maintained in spreadsheets initially. Dedicated ATS or analytics tools add value for scale and automation once your data inputs are clean and consistent.
Pro Tip: Set your benchmarks before your first reporting cycle, not after. Benchmarks set retroactively tend to justify existing performance rather than challenge it.
Benchmarks and performance targets for key recruiting KPIs
The table below gives you reference points for comparing your performance against industry standards.
| KPI | Industry average | Best-of-breed target |
|---|---|---|
| Time-to-fill | 45–65 days | Under 30 days |
| Cost-per-hire | Varies by role and industry | Trending downward year over year |
| Offer acceptance rate | 75–85% | Above 85% |
| Candidate NPS | +20 to +40 | Above +50 |
| Applicants per opening | Baseline varies by system | 49% higher with best-of-breed ATS |
| Interview-to-offer ratio | 4:1 to 6:1 | 3:1 or lower |
| First-year attrition | 20–30% for many industries | Below 15% |
These benchmarks shift by industry and role type. A 45-day time-to-fill is acceptable for a senior engineering role but slow for a high-volume customer service position. Clean, consistent data in integrated dashboards enables timely and trusted recruiting decisions, which means your benchmarks are only as reliable as your data quality. Revisit your targets quarterly and adjust them as your hiring volume and complexity change.
Common enterprise recruiting KPI mistakes HR leaders should avoid
Most KPI failures in enterprise recruiting come from the same handful of errors.
“Measuring what actually matters requires linking KPIs to hiring outcomes that influence retention, productivity, and revenue, not just volume or speed. The most common mistake is tracking what is easy to count rather than what is meaningful to the business.” — People Science, Recruiting ROI Framework
- Tracking volume over quality. Counting hires or resumes screened tells you nothing about whether those hires succeeded. Quality of hire and long-term fit are the metrics that actually predict business impact.
- Ignoring vacancy cost in time-to-fill. Time-to-fill reported without a dollar figure attached rarely drives urgency. Multiply your daily vacancy cost by your average time-to-fill and present that number to leadership instead.
- Siloing your data. Recruiting data that never connects to performance or retention data produces a blind spot. You cannot improve quality of hire metrics without knowing what happened to your hires after day one.
- Setting benchmarks after the fact. Targets created to match current performance are not targets. They are descriptions.
- Reporting to the wrong audience. A recruiter needs source-to-hire conversion data. A CFO needs recruitment ROI. Presenting the wrong KPIs to the wrong stakeholder wastes credibility.
The corrective action for all of these is the same: start recruitment analytics with the key business decisions you need to inform, then build your KPI set around those decisions.
Key Takeaways
The most effective enterprise recruiting KPI strategy links outcome metrics directly to financial and organizational impact, not just hiring volume or speed.
| Point | Details |
|---|---|
| Prioritize outcome over activity metrics | Quality of hire and first-year attrition reveal business impact; interview counts do not. |
| Translate KPIs into financial terms | Multiply time-to-fill by daily vacancy cost to make recruiting data meaningful to finance. |
| Integrate your data systems | Connect ATS, HRIS, and performance data to get accurate quality-of-hire and attrition numbers. |
| Benchmark before you measure | Set targets before your first reporting cycle to avoid benchmarks that justify weak performance. |
| Match KPIs to business decisions | Select 3–5 KPIs tied to the decisions your leadership team actually needs to make. |
Why most enterprise KPI dashboards miss the point
I have reviewed recruiting dashboards at organizations ranging from 200 to 20,000 employees. The pattern is consistent: the dashboards are full, and the insights are thin. Teams track time-to-fill, cost-per-hire, and hires-per-month because those numbers are easy to pull from an ATS. They rarely track quality of hire or first-year attrition because those numbers require connecting systems that were never designed to talk to each other.
The shift I have seen work is treating KPI selection as a business problem, not a reporting problem. When a TA leader asks “what decisions does our CEO need to make about talent this quarter?” the KPI list gets shorter and sharper immediately. Recruitment ROI, quality of hire, and first-year attrition become the center of the conversation. Time-to-fill becomes a supporting metric, not the headline.
The other change that matters is translating every KPI into money before presenting it to leadership. A 55-day time-to-fill means nothing to a CFO. A $110,000 vacancy cost for a single senior role gets a budget approved. Recruiter efficiency metrics work the same way: frame them in terms of cost avoided or revenue protected, and the conversation changes entirely.
The teams that get this right are not necessarily the ones with the best tools. They are the ones with the clearest agreement on what they are trying to decide.
— Jimmie
How Talent Approved helps you track what actually matters
Improving your recruiting KPIs starts with better data at the screening stage. Talent Approved gives HR teams and recruiters an AI-powered platform for building and managing skill assessments that generate structured, role-specific candidate data from the first interaction.
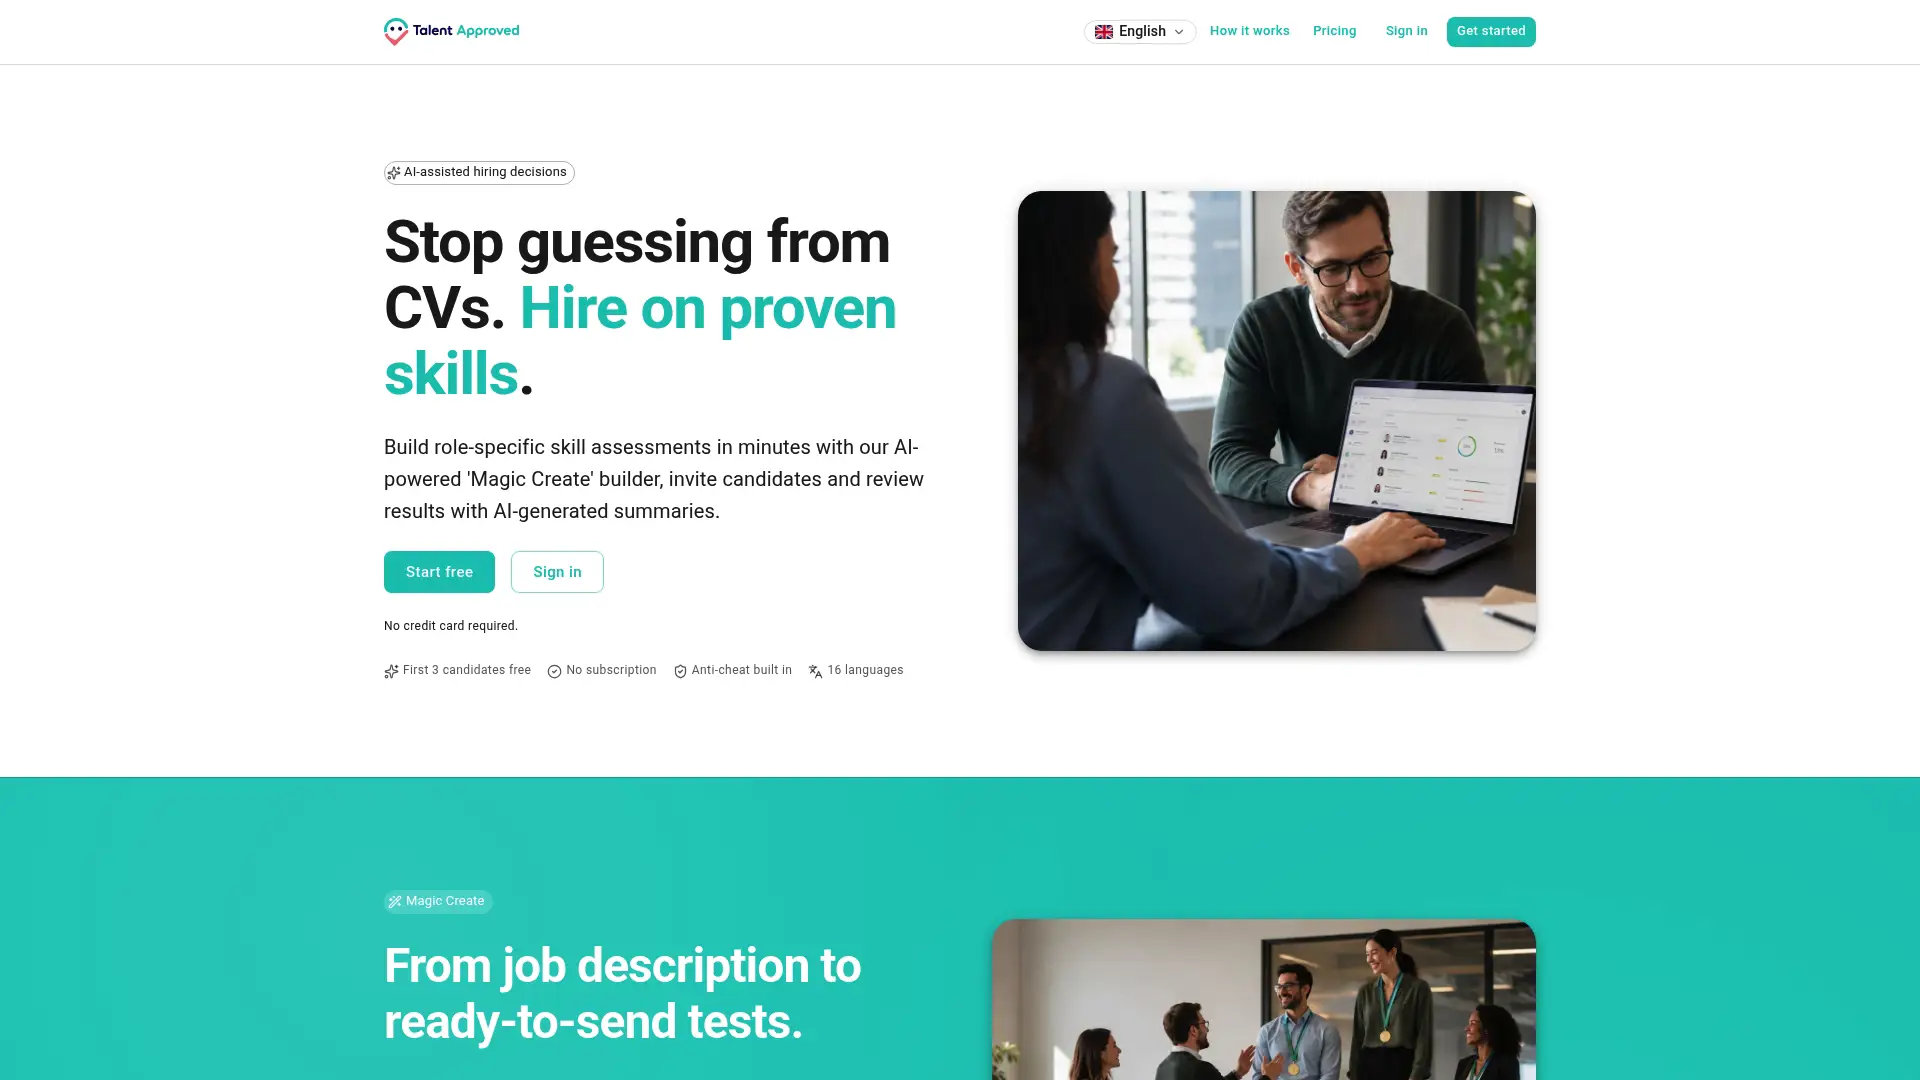
The platform’s candidate ranking and AI scoring feature produces objective, comparable data across every applicant, which feeds directly into quality-of-hire calculations. The Magic Create feature builds tailored assessments from a job description in minutes, reducing time-to-screen without sacrificing accuracy. Built-in anti-cheat mechanisms and AI-generated summaries give your team reliable pre-hire data that connects to post-hire performance tracking. When your screening data is clean and structured, your KPI dashboard stops being a reporting exercise and starts being a decision tool.
FAQ
What are the most important enterprise recruiting KPIs?
Quality of hire, time-to-fill, cost-per-hire, offer acceptance rate, and first-year attrition are the most impactful KPIs for enterprise recruiting. Quality of hire and first-year attrition are the strongest predictors of business value.
How many recruiting KPIs should an enterprise track?
Recruiters should select 3–5 KPIs tied to the key business decisions their leadership team needs to make. Tracking more than that typically produces metrics sprawl without improving decisions.
What is a good offer acceptance rate benchmark?
Offer acceptance rate typically clusters in the 75–85% range. Rates below 75% usually indicate compensation issues or a poor candidate experience in the final stages of hiring.
How do I calculate recruitment ROI?
Recruitment ROI compares the financial value generated by new hires to the total cost of acquiring them. Translating KPIs into monetary terms, such as vacancy cost impact or productivity contribution, makes this calculation understandable for C-suite audiences.
What is candidate NPS and why does it matter?
Candidate NPS measures how likely candidates are to recommend your hiring process to others. Scores above +50 indicate strong candidate experience and efficient employer branding, which directly affects your ability to attract future applicants.