
Recruiter Efficiency Metrics: A 2026 HR Guide

A recruiter efficiency metric is a quantifiable indicator that measures how effectively a recruitment team balances speed, cost, and hire quality across the hiring process. These metrics, formally called recruitment performance metrics or key performance indicators for recruiters, give HR professionals a clear picture of where their process works and where it breaks down. Core indicators include time-to-fill, cost-per-hire, quality-of-hire, and offer acceptance rate. Together, they help you improve recruitment efficiency without sacrificing the candidate quality your organization depends on.
What is a recruiter efficiency metric and why does it matter?
Recruiter efficiency metrics are defined as the set of data points that reveal whether your hiring process produces the right hires at the right speed and cost. They are not just reporting tools. They are decision-making tools that expose bottlenecks, flag underperformance, and justify resource allocation to leadership.
The distinction between activity metrics and output metrics is where most teams go wrong. A recruiter who sends 200 emails a week, but converts only 2% of candidates to interviews, is less efficient than one who sends 80 emails and converts 12%. True recruiter efficiency is measured by pipeline conversion ratios, not volume of tasks. That shift in thinking changes how you build your entire measurement framework.

Without a structured approach to recruiter productivity measurement, HR teams default to gut-feel assessments. That creates inconsistency, bias, and missed hiring targets. Structured metrics connect individual recruiter behavior to organizational outcomes, making performance conversations objective and fair.
What are the essential recruiter efficiency metrics?
The core metrics that define recruitment process efficiency fall into two categories: process-level and recruiter-level indicators.
Process-level metrics:
- Time-to-fill: The number of days from job requisition approval to accepted offer. Global benchmarks range from 36–44 days, with specialized engineering or technical roles often exceeding 50 days.
- Time-to-hire: The number of days from a candidate’s first application to their accepted offer. This is narrower than time-to-fill and reflects recruiter responsiveness.
- Cost-per-hire: Total recruiting spend divided by the number of hires in a given period. This includes advertising, agency fees, and internal recruiter time.
- Offer acceptance rate: The percentage of offers extended that candidates accept. A low rate signals misalignment on compensation, role expectations, or candidate experience.
- Quality-of-hire: A composite score typically built from 90-day retention rates, hiring manager satisfaction scores, and new hire performance ratings.
Recruiter-level metrics:
- Candidate submittal cycle time: The time from receiving a CV to delivering a formatted submission to the hiring manager. This metric, highlighted in recruiter performance research, directly reflects individual recruiter speed and thoroughness.
- Stage-by-stage conversion rates: The percentage of candidates who advance from each stage to the next, such as submittal-to-interview and interview-to-offer ratios.
These two categories work together. Process metrics tell you how the system performs. Recruiter-level metrics tell you who is driving results and who needs support.
Pro Tip: Track conversion rates at every pipeline stage rather than total placements. A recruiter with a strong submittal-to-interview rate but a weak interview-to-offer rate has a specific coaching need, not a general performance problem.
How do recruiter efficiency metrics impact hiring quality?
Speed and quality are not natural allies in hiring. Optimizing only for time-to-fill creates pressure to move candidates through the process before they are properly evaluated. Solely optimizing for speed degrades candidate quality and retention. That outcome costs far more than a longer, more careful search.
The most effective teams use a balanced scorecard approach that pairs speed metrics with quality indicators. Here is how to build that balance:
- Set a speed floor, not a ceiling. Define the minimum acceptable time-to-fill for each role category. Roles below that floor get investigated, not celebrated, because speed without quality is a liability.
- Pair every speed metric with a quality counterpart. Time-to-fill pairs with 90-day retention. Cost-per-hire pairs with hiring manager satisfaction. This prevents single-metric optimization.
- Use quality-of-hire as your north star. Quality-of-hire is the metric that most directly reflects whether your recruitment process is working. Build your other metrics around it. Improving quality of hire requires deliberate measurement at every stage.
- Review offer acceptance rate monthly. A declining acceptance rate is an early warning signal. It often predicts a quality-of-hire problem before it shows up in retention data.
The risk of ignoring this balance is real. A team that hits its time-to-fill targets every quarter but sees 40% first-year attrition is not efficient. It is expensive. The cost of a bad hire, including lost productivity, rehiring, and onboarding, far exceeds the cost of a slower, more thorough process.
Pro Tip: When presenting metrics to leadership, always show speed and quality data side by side. A single metric in isolation invites the wrong conclusions and the wrong incentives.
What are common pitfalls in measuring recruiter efficiency?
Measurement errors are as damaging as the inefficiencies they are meant to expose. These are the mistakes HR teams make most often:
- Confusing activity with output. High call volume, high email volume, and high job posting counts are inputs. High activity volume is commonly mistaken for efficiency, but it conceals process bottlenecks. Conversion rates reveal the truth.
- Using short data windows. Weekly snapshots are too noisy to be reliable. Rolling monthly or quarterly data gives you the trend lines needed to distinguish a real performance shift from a random bad week.
- Tracking too many metrics. Limiting tracked metrics to 5–7 key indicators connected to business outcomes improves decision-making. Dashboards with 20+ metrics create noise, not clarity.
- Ignoring leading indicators. Lagging indicators like total placements tell you what happened. Leading indicators like candidate response speed and submission quality tell you what is about to happen. Balancing leading and lagging indicators is what separates reactive teams from proactive ones.
- Failing to segment by role type. A 30-day time-to-fill is excellent for a retail associate role and alarming for a senior data scientist role. Benchmarks must reflect role complexity, or they mislead.
The clearest sign that your measurement system has a problem is when your metrics look good but your hiring managers are dissatisfied. That gap means you are measuring the wrong things.
How can HR professionals implement recruiter efficiency analysis?
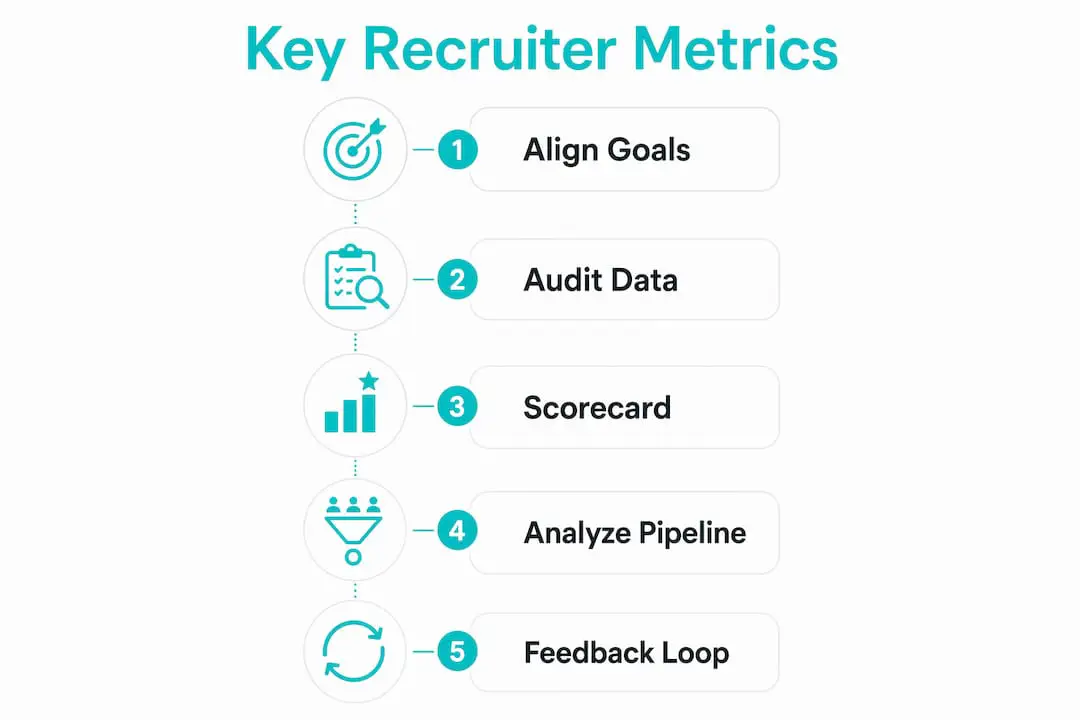
Implementing a recruiter efficiency analysis framework requires a structured approach. Ad hoc measurement produces ad hoc results.
Step 1: Align metrics to business goals. Start by identifying what your organization needs from recruiting this year. High-growth companies prioritize time-to-fill. Quality-focused companies prioritize quality-of-hire and retention. Your metrics must reflect your actual priorities, not a generic industry template. Structured metrics improve strategic workforce planning over descriptive reporting alone.
Step 2: Audit your data sources. Your applicant tracking system (ATS) is the primary data source for most recruitment metrics. Confirm it captures stage dates, source data, and offer outcomes accurately. Data gaps at this stage make every downstream metric unreliable.
Step 3: Build a recruiter scorecard. A scorecard consolidates your 5–7 chosen metrics into a single view per recruiter. Update it monthly. Include both leading indicators (submittal cycle time, response rate) and lagging indicators (quality-of-hire, 90-day retention). This gives managers a complete picture rather than a partial one.
Step 4: Identify bottlenecks through conversion analysis. Map your pipeline stage by stage. Where do candidates drop off? Where does time accumulate? A high submittal-to-interview rate paired with a low interview-to-offer rate points to a problem in interview design or hiring manager alignment. Reviewing hiring manager alignment often resolves conversion problems that look like recruiter performance issues.
Step 5: Create a feedback loop. Share scorecard results with recruiters monthly. Connect metric trends to specific process changes. When a recruiter improves their submittal-to-interview rate after adjusting their screening criteria, document that connection. Feedback loops turn data into learning.
| Implementation step | Primary metric affected |
|---|---|
| Align metrics to business goals | Quality-of-hire, cost-per-hire |
| Audit ATS data sources | All pipeline conversion rates |
| Build recruiter scorecard | Submittal cycle time, offer acceptance rate |
| Analyze stage-by-stage conversion | Interview-to-offer rate, time-to-hire |
| Establish monthly feedback loops | 90-day retention, hiring manager satisfaction |
Key Takeaways
Recruiter efficiency metrics work only when they connect speed, cost, and quality data to specific business outcomes rather than measuring activity in isolation.
| Point | Details |
|---|---|
| Define metrics by output, not activity | Conversion rates reveal true efficiency; call volume and email counts do not. |
| Limit your dashboard to 5–7 metrics | Fewer, well-chosen metrics produce clearer decisions than large, noisy dashboards. |
| Pair speed with quality indicators | Every speed metric needs a quality counterpart to prevent harmful single-metric optimization. |
| Use rolling data windows | Monthly or quarterly trends are reliable; weekly snapshots introduce misleading noise. |
| Align metrics to role complexity | Benchmarks must reflect the specific demands of each role type, not a single universal standard. |
Why most teams measure the wrong things
Recruiters are under real pressure to fill roles fast. That pressure shapes which metrics get tracked, and it usually favors the ones that are easiest to count. Call volume, applications reviewed, and jobs posted are all visible and immediate. They also tell you almost nothing about whether your recruitment process is working.
The teams I have seen perform best over time are the ones that resist the urge to measure everything. They pick a small set of metrics that connect directly to what the business actually cares about, whether that is retention, time-to-productivity, or hiring manager satisfaction. Then they track those metrics consistently over months, not weeks. That discipline is harder than it sounds when leadership is asking for weekly updates.
The other pattern worth naming is the quality trap. When a team hits its time-to-fill targets consistently, there is a natural tendency to declare success. But if 90-day retention is declining at the same time, the speed gains are an illusion. The real cost shows up six months later in rehiring and lost productivity. Pairing speed and quality metrics from the start prevents that trap. It also makes the business case for investing in better screening tools, like skill-based assessments, far easier to make.
— Jimmie
Talent Approved and your recruiter efficiency goals
Skill-based assessments directly improve two of the metrics that matter most: quality-of-hire and offer acceptance rate. When candidates are evaluated on actual job-relevant skills rather than CV credentials, hiring managers get better information and make better decisions.

Talent Approved builds role-specific assessments in minutes using its Magic Create feature. You input a job description, and the platform generates a structured, validated test. Built-in anti-cheat mechanisms and AI-generated candidate summaries reduce the time your team spends reviewing unqualified applicants. That efficiency shows up directly in your submittal-to-interview conversion rate. See how it works or review current pricing to find the right plan for your team.
FAQ
What is a recruiter efficiency metric?
A recruiter efficiency metric is a quantifiable measure that evaluates how well a recruiter or hiring team balances speed, cost, and quality in the hiring process. Core examples include time-to-fill, cost-per-hire, quality-of-hire, and offer acceptance rate.
How do you measure recruiter efficiency accurately?
Accurate measurement requires tracking pipeline conversion rates at each stage, using rolling monthly or quarterly data windows, and pairing speed metrics with quality indicators like 90-day retention and hiring manager satisfaction scores.
What is a good time-to-fill benchmark?
Standard time-to-fill benchmarks range from 36–44 days globally, with specialized or technical roles often exceeding 50 days. Benchmarks should always be adjusted for role complexity and industry context.
Why is quality-of-hire the most important recruitment metric?
Quality-of-hire directly measures whether the recruitment process produces employees who perform and stay. Speed and cost metrics only measure how the process runs; quality-of-hire measures whether it works.
How many recruitment metrics should a team track?
Limiting tracked metrics to 5–7 key indicators connected to business outcomes produces clearer decisions than large dashboards. More metrics create noise and reduce the team’s ability to act on what the data shows.