
How Enterprise Hiring ROI Is Measured: A Finance-Ready Guide

Enterprise hiring ROI is measured using the formula: Recruitment ROI = (Value of Hires − Total Recruiting Cost) ÷ Total Recruiting Cost × 100. The cost side is auditable. The value side is not, unless you instrument it deliberately. That instrumentation is the real measurement challenge, and it is where most enterprise TA teams fall short.
Finance will not accept “estimated value” as a P&L input without evidence. To make the formula credible, you need to build four outcome-linked inputs that convert ROI from a guessing exercise into something a CFO will sign off on:
- Decision velocity: How quickly hiring teams move from qualified candidate to offer, measured in days per stage
- Quality of signal: How well your selection process predicts on-the-job performance, tracked through 90-day and 12-month manager ratings
- Candidate experience: NPS or short post-process surveys that flag friction before it inflates cost-per-hire
- Hiring-manager confidence: A structured post-hire check-in score that anchors your quality-of-hire calculation
Without these four inputs, the ROI formula produces a number. With them, it produces a number finance can audit.
Table of Contents
- What metrics actually measure enterprise hiring ROI?
- How do you calculate hiring ROI step by step?
- How do you build a measurement framework finance will accept?
- Which systems do you need to measure hiring ROI accurately?
- Where do traditional hiring ROI measurements fail?
- What tactics actually improve enterprise hiring ROI?
- Worked examples: spreadsheet-ready hiring ROI calculations
- How validated skill assessments improve quality-of-hire and ROI
- Key Takeaways
- The measurement tradeoff that actually builds finance trust
- Talent Approved helps you build the quality-of-hire signal that ROI depends on
- Useful sources and further reading
- FAQ
What metrics actually measure enterprise hiring ROI?
Outcome metrics come first. Quality-of-hire, first-year attrition, and time-to-productivity are the KPIs CHROs and CFOs care about most. Fifty-four percent of recruiting professionals identify quality-of-hire as their top priority metric. Efficiency metrics like time-to-fill matter too, but only as inputs to vacancy cost, not as standalone proof of value.
| Metric | Definition | How to measure | Role in ROI |
|---|---|---|---|
| Quality-of-hire (QoH) | Composite score of new-hire performance | 90-day manager rating (1–10) + 12-month retention binary | Primary value-side proxy for non-revenue roles |
| Time-to-productivity (ramp) | Days from start date to full output | Manager assessment at 30/60/90 days; project readiness gates | Converts to dollar impact via daily salary × ramp days |
| Revenue-per-hire | Direct revenue attributed to a hire | CRM closed-won data, margin reports | Value numerator for sales and billable roles |
| First-year attrition | % of hires who leave within 12 months | HRIS termination date vs. hire date | Signals value destruction; forces a second search cost |
| Total cost-per-hire | All internal + external recruiting spend per hire | ATS + payroll + finance system | ROI denominator |
| Vacancy cost per day | Revenue or productivity lost while a role is open | Role salary ÷ 220 working days × productivity factor | Quantifies urgency; often undercounted |
| Hiring-manager satisfaction | Post-hire confidence score | Structured 30-day survey | Leading indicator for QoH; auditable |
| Candidate experience NPS | Candidate sentiment through the process | Post-process survey | Predicts offer acceptance rate and employer brand cost |
Fifty-four percent of recruiting professionals name quality-of-hire as their top priority metric, which aligns with what finance actually wants to see: evidence that hires performed, not just that they were hired quickly.
Stat to know: Enterprise tech recruiting leaders measure delivery-focused metrics such as 90-day performance stability, SLA delivery performance, and hiring-manager confidence rather than fill-rate alone, because those metrics reveal whether hires support long-term project goals.
Candidate experience and hiring-manager confidence are leading indicators. They do not appear directly in the ROI formula, but they predict whether your value estimates will hold. A low offer acceptance rate, for example, means you paid full search cost and still lost the candidate, which quietly destroys ROI before a single day of productivity is counted.
How do you calculate hiring ROI step by step?
A reproducible calculation starts with a defined cohort and ends with a sensitivity check. Here is the sequence:
-
Define your cohort and attribution window. Group hires by role family, quarter, and business unit. Set a 90-day window for leading metrics and a 12-month window for lagging metrics like first-year attrition and revenue-per-hire.
-
Assemble all cost lines. Use this checklist:
- Internal recruiter salary (prorated to hours spent per hire)
- Hiring manager interview time (hours × loaded hourly rate)
- Job board advertising and sourcing tool subscriptions
- Agency fees (if applicable)
- Assessment and background check costs
- Onboarding program costs (facilitator time, materials)
- Equipment and software provisioning
-
Select your value-of-hire proxy. For revenue roles, use direct contribution from CRM data. For non-revenue roles, use one of three defensible proxies: (a) 1–2× first-year salary as estimated output once ramped, (b) replacement cost avoided by retaining a strong performer, or © a composite QoH score converted to a dollar range using salary benchmarks.
-
Apply the formula. Example: A cohort of sales hires costs a total amount representing the aggregate recruiting expenses. Each hire generates a significant first-year revenue contribution. Net value equals total revenue minus total recruiting costs. ROI is calculated as net value divided by recruiting costs, multiplied by 100, resulting in a strong positive percentage.
-
Run sensitivity checks. Rerun the calculation at 50% of your value estimate (conservative) and at 75% (base case). If ROI stays positive at the conservative estimate, the number is defensible. If it flips negative, your value proxy needs tightening before you present it to finance.
The full cost of recruitment includes internal costs, external costs, and indirect costs. Most teams capture external costs reliably but undercount internal time by a wide margin. Practitioners report that hidden internal costs are frequently undercounted by 30–50% in standard enterprise calculations, which means your denominator is likely smaller than it should be, making ROI look better than it is.

How do you build a measurement framework finance will accept?

The decision-first rule is the foundation. Recruiting leaders recommend starting with 3–5 specific decisions the metrics must inform and limiting KPIs to 5–7 outcome-focused indicators. A metric that does not support a pre-defined decision should not be tracked.
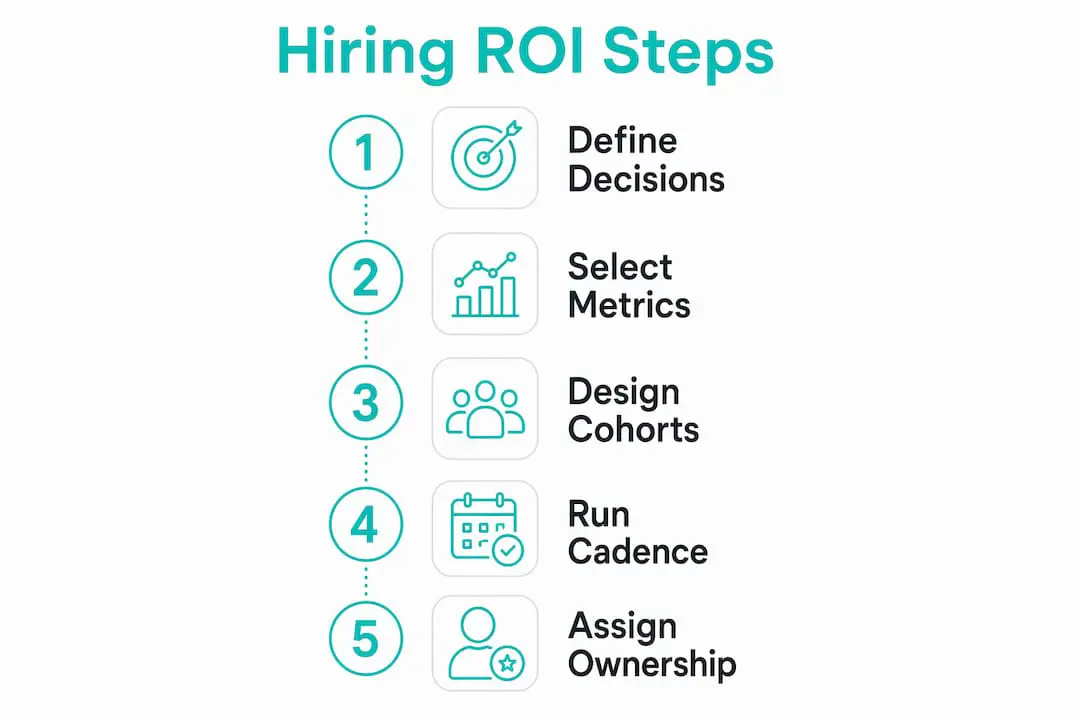
Cohort design matters as much as metric selection. Role-level cohorts of at least 10–15 hires give you enough signal to detect real performance differences. Smaller cohorts produce noisy results that finance will dismiss. Attribution windows should match the role’s ramp profile: 90–180 days for technical delivery roles, 12 months for revenue-generating roles where full productivity takes longer to materialize.
Cadence: Run leading indicators monthly (decision velocity, hiring-manager confidence, candidate NPS) and lagging metrics quarterly (quality-of-hire composite, first-year attrition, revenue-per-hire). This combination gives finance both an early warning system and an auditable long-term record.
Governance: Assign metric ownership explicitly. One person owns the QoH data collection process; one person owns the cost-per-hire calculation. When methodology changes, version it with a date and a note explaining what changed and why. Finance auditors need to trace assumptions back to their source.
Pro Tip: When choosing cohort sizes and attribution windows, err toward longer windows and larger cohorts early in your program. A 90-day window with a cohort of eight hires will produce a number, but finance will not trust it. A 12-month window with 15+ hires in the same role family produces a number worth presenting. Reduce the window only when you have enough historical data to validate that the shorter window predicts the longer-term outcome.
For practical KPI selection and dashboard design aligned to enterprise needs, the enterprise recruiting KPIs guide from Talent Approved covers the decision-first framework in detail.
Which systems do you need to measure hiring ROI accurately?
Accurate measurement requires stitching together at least four systems. Missing even one creates gaps that undermine the audit trail.
| System | Primary role in ROI measurement | Critical fields to extract |
|---|---|---|
| ATS (e.g., Greenhouse, Ashby, Lever) | Sourcing channel, timestamps, stage progression | Source, open date, offer date, hire date, hiring manager ID |
| HRIS (e.g., Workday, BambooHR) | Official hire date, termination date, role metadata | Employee ID, hire date, termination date, department, manager |
| Payroll system | Loaded compensation for cost-per-hire and vacancy cost | Base salary, benefits load, start date |
| Performance system (e.g., Lattice, Culture Amp) | 90-day and 12-month ratings for QoH | Rating score, rating date, reviewer ID |
| CRM or project system | Revenue or delivery attribution for value-of-hire | Closed-won revenue, project completion dates, SLA data |
The most common integration blocker is mismatched identifiers across systems. An employee ID in your HRIS may not match the candidate ID in your ATS, and a hire date in payroll may differ from the offer-accepted date in your ATS by days or weeks. These discrepancies make joins unreliable and give finance a reason to question your numbers.
Common pitfalls to address before you build your first ROI report:
- Timezone and date field inconsistencies: ATS timestamps are often UTC; HRIS dates are local. Standardize before joining.
- Missing hiring-manager metadata: If your ATS does not capture the hiring manager at the requisition level, you cannot segment QoH by manager, which removes one of the most useful analytical dimensions.
- No unique identifier for the hiring event: Create a composite key (employee ID + hire date) if a single shared ID does not exist across systems.
When full integration is not possible, use manual joins on a sample of 20–30 recent hires to validate your assumptions. A shortened attribution window (60 days instead of 90) reduces the data-collection burden while still producing a usable signal. The goal is an auditable process, not a perfect one.
Where do traditional hiring ROI measurements fail?
The most common mistake is undercounting internal time. Hiring manager interview time is rarely captured in standard cost-per-hire calculations, yet a single senior manager conducting six interviews at two hours each represents 12 hours of loaded cost per hire. Multiply that across a cohort of 20 hires and the omission is material.
Pro Tip: Run a five-hire audit on your most recent cohort. Pull calendar data or ask hiring managers to log actual interview hours for those five hires. Compare the result to your assumed estimate. Practitioners report a 30–50% undercount in internal time assumptions when this audit is done for the first time. If your audit shows a gap larger than 20%, rebuild your cost model before presenting ROI to finance.
Four mistakes that get ROI figures rejected by finance, and how to fix them:
Treating estimated value as audited revenue. The value side of the formula is always an estimate for non-revenue roles. Label it clearly as an estimate, show your methodology, and present a conservative range alongside your base case. Finance respects transparency; it rejects false precision.
Ignoring vacancy cost. An open role has a daily productivity cost. For a $120,000 salary role with a 220-day working year, the daily cost is roughly $545 before accounting for lost output. A delay of several weeks in filling a role can result in material vacancy costs due to lost productivity and other factors, which should appear in your denominator.
Efficiency-only reporting. Time-to-fill is a useful operational metric, but presenting it to leadership without connecting it to outcome metrics tells finance nothing about value. A fast hire who leaves in 90 days produces negative ROI regardless of how quickly the search closed.
Metric sprawl. Tracking 20 metrics creates reporting overhead and dilutes focus. Effective teams limit KPIs to 5–7 outcome-focused metrics and enforce the decision-first rule: if a metric does not support a specific decision, it does not get tracked.
What tactics actually improve enterprise hiring ROI?
Improvement tactics fall into five levers. Prioritize by impact relative to effort, not by what is easiest to implement.
- Improve source quality. Calculate quality-adjusted cost-per-hire by source channel. Referrals consistently outperform other sources at nearly every stage of the hiring funnel, with a substantially higher percentage of referred candidates passing initial screens compared to the overall average. Reallocating sourcing budget toward high-QoH channels raises ROI without increasing total spend.
- Strengthen selection signal. Structured interviews and validated assessments reduce variance in hiring decisions. Better signal at the selection stage means fewer early exits and lower replacement costs.
- Shorten ramp time. A 30-day reduction in time-to-productivity for a $100,000 salary role saves roughly $4,100 in unproductive salary cost. Structured onboarding projects with clear 30/60/90-day milestones are the most direct lever.
- Reduce vacancy cost through faster decisions. Scheduling delays and multi-stakeholder approval chains are the most common sources of avoidable vacancy cost. Streamlining the offer-creation step alone can recover days of productivity cost per hire.
- Reduce early turnover. First-year attrition forces a second search, doubling the cost denominator for that hire. Improving fit accuracy at the selection stage is the highest-leverage intervention.
Impact vs. effort prioritization: Start with source quality analysis (low effort, high impact) and structured 90-day check-ins (low effort, high impact). Tackle onboarding redesign and assessment implementation as medium-effort, high-impact projects. Reserve full system integration for a later phase.
| Tactic | Estimated impact on ROI | Implementation effort |
|---|---|---|
| Reallocate sourcing to high-QoH channels | High | Low |
| Add structured 90-day manager check-ins | High | Low |
| Implement validated skill assessments | High | Medium |
| Redesign onboarding with 30/60/90 milestones | Medium | Medium |
| Full ATS-HRIS-payroll integration | High (long-term) | High |
To pilot any intervention, define a baseline cohort first, then run the new process for one quarter with a parallel cohort. Compare QoH scores and first-year attrition rates between the two groups. Even a modest improvement in quality-of-hire metrics compounds quickly when replacement costs are factored in.
Worked examples: spreadsheet-ready hiring ROI calculations
Example 1: Sales cohort (revenue-generating roles)
Inputs:
- Cohort size: 8 sales hires
- Total recruiting cost: $48,000 ($6,000 per hire)
- Average first-year revenue contribution per hire: $90,000 (from CRM closed-won data)
- First-year attrition: 1 of 8 hires (12.5%)
Calculation:
- Effective hires producing value: 7
- Total value: 7 × $90,000 = $630,000
- Replacement cost for 1 early exit: $6,000 (search cost repeated)
- Adjusted total cost: $48,000 + $6,000 = $54,000
- ROI = ($630,000 − $54,000) ÷ $54,000 × 100 = 1,067%
Sensitivity check: At 50% of revenue contribution ($45,000 per hire), ROI = ($315,000 − $54,000) ÷ $54,000 × 100 = 483%. Still strongly positive.
Example 2: Technical delivery cohort (time-to-productivity proxy)
Inputs:
- Cohort size: 10 software engineers
- Total recruiting cost: $80,000 ($8,000 per hire)
- Average loaded annual salary: $140,000
- Average ramp time to full productivity: 90 days
- Ramp cost (unproductive salary): $140,000 ÷ 365 × 90 = $34,521 per hire
Value proxy: 1× first-year salary in output once ramped = $140,000 per hire. Subtract ramp cost: $140,000 − $34,521 = $105,479 net value per hire.
Calculation:
- Total net value: 10 × $105,479 = $1,054,790
- Total cost: $80,000 + (10 × $34,521 ramp cost) = $425,210
- ROI = ($1,054,790 − $425,210) ÷ $425,210 × 100 = 148%
Adaptation notes: Changing the ramp assumption from 90 to 60 days raises net value per hire by roughly $19,000 and lifts ROI to approximately 200%. Present both scenarios to finance with the methodology clearly labeled. For roles where a tailored job description drives better candidate alignment, ramp time tends to shorten because candidates arrive with more relevant skills already mapped.
Template layout (copy into a spreadsheet):
| Input cell | Label | Example value |
|---|---|---|
| A1 | Cohort size | 10 |
| A2 | Total recruiting cost ($) | 80,000 |
| A3 | Avg. loaded annual salary ($) | 140,000 |
| A4 | Ramp days | 90 |
| A5 | Value proxy (× salary) | — |
| Formula cell | Output | Formula |
| B1 | Ramp cost per hire | =A3/365*A4 |
| B2 | Net value per hire | =(A3*A5)-B1 |
| B3 | Total net value | =B2*A1 |
| B4 | Total cost | =A2+(B1*A1) |
| B5 | ROI (%) | =(B3-B4)/B4*100 |
How validated skill assessments improve quality-of-hire and ROI
The quality-of-signal problem is where most enterprise ROI calculations break down. When selection relies on unstructured interviews and resume review, the link between the hiring decision and the hire’s eventual performance is weak. That weak link makes the value side of the ROI formula hard to defend.
Validated skill assessments change the signal quality at the point of selection. Instead of estimating fit from a 45-minute conversation, hiring teams get structured, role-specific performance data on every candidate before the offer stage. That data feeds directly into quality-of-hire calculations and reduces the variance in 90-day performance ratings.
Example comparison:
| Cohort | Selection method | Avg. 90-day QoH score | First-year attrition | Replacement cost avoided |
|---|---|---|---|---|
| Baseline (12 hires) | Unstructured interviews | — | — | — |
| Assessment-enabled (12 hires) | Structured interviews + skill assessments | — | 8% (1 exit) | $16,000 (2 searches avoided) |
The delta in replacement cost alone ($16,000 saved on two avoided searches) partially offsets the cost of running assessments across the cohort. When the improvement in 90-day QoH scores is translated into a productivity estimate, the value-side gain is larger still.
Stat to note: Quality-of-hire is consistently identified as the most important TA metric by recruiting professionals, yet it requires discipline to collect reliably. Assessments create a structured, repeatable data point that anchors QoH scores to observable performance rather than interviewer impression.
Talent Approved’s Magic Create feature generates role-specific assessments from a job description in minutes, which means the assessment data is available for every hire in a cohort, not just the ones where a recruiter had time to build a test manually. Built-in anti-cheat mechanisms and AI-generated candidate summaries make the review process faster and the signal more comparable across candidates. For teams piloting assessment-driven measurement, the candidate ranking and AI scoring feature produces the structured output that feeds directly into a quality-of-hire calculation.
Disclosure: The cohort comparison above is illustrative, using plausible ranges consistent with published research on assessment-driven hiring improvements. Actual results will vary by role, industry, and assessment design.
Key Takeaways
Enterprise hiring ROI requires instrumenting the value side of the formula with outcome metrics (quality-of-hire, time-to-productivity, first-year attrition) and auditable cost lines that include internal time, vacancy cost, and replacement spend.
| Point | Details |
|---|---|
| Instrument the value side | Use 90-day manager ratings and 12-month retention as your primary quality-of-hire proxies for non-revenue roles. Fifty-four percent of recruiting professionals identify quality-of-hire as their top priority metric. |
| Audit your cost denominator | Internal costs are undercounted by 30–50% in most enterprise calculations; run a five-hire audit to find the gap. |
| Limit to 5–7 KPIs | Tracking more than 7 outcome-focused metrics creates sprawl and reduces the team’s capacity to act on findings. |
| Integrate four core systems | ATS, HRIS, payroll, and performance data must share a unique identifier to produce an auditable ROI calculation. |
| Talent Approved assessments | Structured skill assessments from Talent Approved improve quality-of-hire signal and reduce first-year attrition, raising the value side of the ROI formula. |
The measurement tradeoff that actually builds finance trust
The most useful decision a TA team can make when starting an ROI measurement program is to choose a conservative attribution window and stick with it, even when a longer window would produce a more impressive number. When a team presents a 12-month quality-of-hire figure with a clear methodology, a named metric owner, and a versioned calculation, finance engages with it. When a team presents a 24-month revenue attribution with loosely defined assumptions, finance dismisses it.
The decision-first rule is not just a framework principle. It is a credibility strategy. Every metric you track should answer a question someone in leadership is already asking. If no one is asking the question, the metric is overhead. Starting with three decisions, three metrics, and one cohort is more valuable than a 20-metric dashboard that no one acts on.
The teams that win budget for TA programs are the ones that show a quarterly lagging metric improving alongside monthly leading indicators. That combination proves the function is both managing the process and delivering business outcomes. It is a harder discipline to maintain than tracking time-to-fill, but it is the only approach that makes hiring ROI a real P&L conversation.
Talent Approved helps you build the quality-of-hire signal that ROI depends on
The hardest part of measuring enterprise hiring ROI is not the formula. It is producing a quality-of-hire input that finance will accept. Unstructured interviews generate inconsistent data. Resume reviews produce no comparable signal at all. That gap is where the value side of your ROI calculation becomes a guess.

Talent Approved gives hiring teams a faster path to structured, auditable candidate data. The platform’s AI-powered skill assessment builder generates role-specific tests from a job description in minutes, so every candidate in a cohort is evaluated on the same criteria. AI-generated summaries and built-in anti-cheat tools make the review process consistent and defensible. The result is a quality-of-hire input that is grounded in observed performance, not interviewer impression.
For teams ready to pilot assessment-driven measurement, reviewing how Talent Approved works is a practical first step. You can build your first assessment, run it with a single cohort, and compare 90-day QoH scores against your baseline within one quarter.
Useful sources and further reading
- Your recruiting investment: how to measure the ROI — Perelson & Associates: Explains outcome proxies (90-day performance, 12-month retention) as more predictive ROI inputs than efficiency metrics.
- The 4 inputs that turn hiring into a P&L line — Metaview: Covers the four leading indicators (decision velocity, quality of signal, candidate experience, hiring-manager confidence) and the monthly/quarterly cadence for finance reporting.
- How to calculate recruitment ROI and boost hiring efficiency — Salary.com: Step-by-step ROI calculation with worked dollar examples and cost-line breakdowns.
- Recruitment ROI formula: the complete guide — Leonar: Detailed formula guide with per-hire and quarterly roll-up approaches; includes metric definitions and sensitivity framing.
- Recruiting metrics: the complete 2026 guide — Talentprise: Covers quality-of-hire implementation, the 54% priority finding, and the 90-day check-in method.
- How to measure recruiting ROI: metrics every TA leader should track — GoPerfect: Practitioner guidance on undercounted internal costs and the 30–50% undercount finding.
- Measuring recruitment effectiveness: the hiring KPIs that matter most — Bernard Marr: Decision-first framework and the case for limiting KPIs to 5–7 outcome-focused indicators.
- Enterprise tech recruiting metrics: how IT leaders measure hiring success — GTN Technical Staffing: Delivery-focused metrics for technical organizations (SLA adherence, 90-day stability, hiring-manager confidence).
- Best ways to measure recruitment effectiveness — Upwork: Integration guidance, common identifier mismatches, and fallback approaches for teams without full system connectivity.
- Recruiting operations benchmarks: 2026 Talent Trends Report — Ashby: Data on referral passthrough rates, time-to-fill patterns, and how hiring predictability scales with organization size.
- Real costs of recruitment — SHRM: Authoritative breakdown of direct and indirect recruiting costs; useful for building a complete cost-per-hire model.
- Enterprise recruiting KPIs to track for HR success — Talent Approved: Practical KPI selection and dashboard guidance for enterprise TA teams.
- How to improve quality of hire metrics — Talent Approved: Implementation tactics for improving QoH data collection and score reliability.
FAQ
How is recruitment ROI calculated?
Recruitment ROI = (Value of Hires − Total Recruiting Cost) ÷ Total Recruiting Cost × 100. Total recruiting cost includes internal recruiter time, hiring manager hours, job board fees, agency costs, assessments, and onboarding expenses. Value of hire uses direct revenue contribution for sales roles and a proxy (typically 1–2× first-year salary) for non-revenue roles.
What is the 70/30 rule in hiring?
The hiring source split between active sourcing, referrals, and inbound applicants varies widely depending on role type, industry, and labor market conditions. The appropriate balance is a heuristic, not a universal standard.
What does a 300% recruitment ROI mean?
A high ROI means the value a hire created was multiple times the cost of recruiting them. Any positive ROI indicates the hire returned more than it cost. The better benchmark is your own trend improving quarter over quarter.
How do you measure quality-of-hire in an enterprise?
A practical approach is a structured hiring-manager check-in at 90 days using a 1–10 rating scale, combined with a binary 12-month retention indicator. The 90-day check-in is more valuable than most activity metrics when collected consistently, and it provides the auditable input that quality-of-hire calculations require.
How does Talent Approved support hiring ROI measurement?
Talent Approved generates role-specific skill assessments from job descriptions, producing structured, comparable candidate data before the offer stage. That data feeds directly into quality-of-hire calculations, reduces variance in 90-day performance ratings, and lowers first-year attrition by improving selection accuracy, all of which strengthen the value side of the ROI formula.