
Hiring Teams: 5 Steps to Measurement First Assessment Analytics

Assessment analytics is the systematic collection and analysis of process data generated during a test or evaluation, such as response times, revisions, and navigation patterns, to strengthen the evidence behind a score. It improves measurement validity, sharpens assessment design, and gives educators and hiring teams a defensible basis for decisions that used to rest on a single number. The rest of this guide covers what data to capture, which methods apply, and how to implement it without breaking data quality or fairness.
TL;DR:
- Assessment analytics centers on analyzing process data within a single test session to validate what scores truly reflect, rather than tracking engagement over time.
- Collecting detailed process data such as response times, revisions, and navigation sequences is essential for revealing test-taking strategies and cognitive load, beyond final answers.
- Using methods like descriptive dashboards, psychometric models, and sequence analysis helps improve assessment validity and fairness, but only if data quality is rigorously maintained.
- Building reliable assessment analytics requires systematic construct definition, consistent event logging, versioned data pipelines, and continuous data quality checks.
- Practical platforms like Talent Approved automate much of this process, offering role-specific assessments, anti-cheat monitoring, and AI summaries to inform hiring decisions effectively.
Table of Contents
- What Is Assessment Analytics, Exactly?
- What Data Assessment Analytics Actually Captures
- Analytic Methods and Models: From Dashboards to Predictive Scoring
- Building a Practical Data Quality Assessment Workflow
- Validity and Fairness: When Process Data Becomes Real Evidence
- Implementation Checklist: Instrument, Pipeline, QA, Operationalize
- Where Assessment Analytics Shows Up in Practice
- How Talent Approved Puts Assessment Analytics Into Practice
- Quick Wins and Common Pitfalls in Assessment Analytics Projects
- Put Assessment Analytics to Work With Talent Approved
- Sources
- FAQ
What Is Assessment Analytics, Exactly?
Assessment analytics is not a rebrand of learning analytics. It is a narrower, measurement-focused discipline that treats the assessment event itself, not the course or the learning journey, as the unit of analysis. Where learning analytics tracks engagement across weeks of coursework (logins, discussion posts, video views), assessment analytics zooms into a single test session and asks what happened between the first click and the submitted answer.
The MDPI research on assessment analytics in digital assessments frames it as an interdisciplinary field that systematically collects, integrates, and analyzes process data such as response times, navigation patterns, and keystrokes to inform measurement, validation, design, and hiring decisions. That definition matters because it draws a hard line: assessment analytics exists to justify inferences about a construct like reading comprehension or coding aptitude, not simply to describe behavior.
A 2017 paper in PMC/NIH on assessment analytics calls this “the missing step” in learning analytics pipelines. E-assessments generate large volumes of trace data, timestamps, item-level metadata, click sequences, but most institutions still throw it away after computing a total score. That is a lost opportunity, since the same data can feed early-warning systems, student profiling, and adaptive learning recommendations.
The distinction shows up clearly when you compare purposes and units of analysis:
- Learning analytics studies behavior across a course or program, aiming to predict retention or engagement trends.
- Assessment analytics studies behavior within a single assessment or item, aiming to validate what a score actually means.
- Evaluation, in the traditional sense, judges outcomes after the fact using summary statistics like pass rates or grade distributions.
- Assessment analytics operates upstream of evaluation, examining the process that produced those outcomes so the evaluation itself rests on firmer ground.
A Springer Nature chapter on the foundations of assessment analytics adds a useful caveat here: process data only counts as evidence when it’s tied into a coherent interpretive argument linked to the construct you intend to measure. A spike in response time on a math item is meaningless on its own. It becomes evidence only when you can connect it to a hypothesis, such as cognitive load or a misread instruction, and test that hypothesis against other signals.
What Data Assessment Analytics Actually Captures
Most assessment systems have historically logged one thing: the final answer. Assessment analytics asks for two additional layers, and getting all three right is the foundation everything else builds on.
Outcome data is what traditional scoring already captures: item responses, raw scores, subscores by domain or skill, and pass/fail flags. This layer answers “what did the test-taker produce?” It’s necessary but, on its own, thin.
Process data answers “how did they get there?” and this is where assessment analytics earns its name. Concrete examples to instrument:
- Response times per item and per section, which flag rushed guessing or unusual deliberation.
- Revision counts: how often a test-taker changed an answer before submitting.
- Clickstream and navigation sequences, showing whether someone jumped between items or worked linearly.
- Keystroke logs on open-response or coding tasks, which can reveal drafting patterns invisible in the final text.
- Hint requests and tool usage, especially in adaptive or scaffolded assessments.
- Simulation traces for performance-based tasks, like the sequence of actions in a virtual lab or coding sandbox.
Metadata ties the first two layers together and makes them usable later: timestamps down to the second, item IDs mapped to a content taxonomy, session and device information (browser, screen size, connection quality), and the scoring rubric version applied at grading time. Skip metadata and you lose the ability to compare cohorts fairly, since a mobile test-taker and a desktop test-taker may show different clickstream patterns for reasons that have nothing to do with ability.
The MDPI framework is explicit that this multi-dimensional capture—revisions, hint requests, decision pathways—reveals cognitive processes, strategy use, and motivation in ways a single total score cannot. The PMC paper reinforces the same point from a different angle: capturing how someone approaches a problem is often more revealing than whether they landed on the correct final answer, because two test-takers can reach the identical score through very different reasoning paths, only one of which reflects genuine mastery.
Pro Tip: Log raw timestamps in UTC with millisecond precision from day one, even if your current dashboards only need minute-level granularity. Retrofitting timestamp precision into historical data is far harder than capturing it up front, and sequence analysis depends on exact ordering when two events land in the same second.
The practical failure mode here isn’t capturing too little. It’s capturing everything and structuring nothing, which leaves you with terabytes of clickstream logs and no schema that lets you actually query them by item, session, or construct six months later.
Analytic Methods and Models: From Dashboards to Predictive Scoring
Once the data exists, the methods you apply should scale with the stakes of the decision. A low-stakes formative quiz doesn’t need the same rigor as a certification exam or a pre-employment skills test, and running full psychometric validation on every classroom quiz wastes analyst time better spent elsewhere.
-
Descriptive analytics and dashboards. Start here regardless of stakes. Item-level dashboards showing response time distributions, difficulty indices, and completion rates catch obvious problems fast, a mistyped answer key, an item everyone skips, a time limit that’s clearly too short before you invest in anything heavier.
-
Classical Test Theory (CTT). CTT treats an observed score as true score plus error and gives you quick reliability estimates like Cronbach’s alpha and item discrimination indices. It’s fast to compute and easy to explain to non-technical stakeholders, which makes it the right default for lower-stakes internal assessments.
-
Item Response Theory (IRT). IRT models the probability of a correct response as a function of item difficulty, discrimination, and test-taker ability, independent of which specific items someone answered. That independence is what makes adaptive testing possible: an IRT-calibrated item bank lets you select the next question based on performance so far, shortening tests without sacrificing precision. The tradeoff is cost. IRT calibration needs larger sample sizes and more statistical expertise than CTT, so it earns its place on high-stakes or high-volume assessments, not a weekly classroom check.
-
Sequence and process models. For tasks with a temporal structure, coding exercises, simulations, multi-step problem solving, Markov chains and state-transition models can characterize how test-takers move between problem states. Sequence analysis groups similar behavioral paths into clusters, which is often how researchers discover that two groups scoring identically got there through meaningfully different strategies, one systematic, one closer to trial and error.
-
Feature engineering and supervised prediction. Process signals like response time variance, revision frequency, and hint usage can become input features for supervised models predicting outcomes such as course completion, item mis-key detection, or candidate success in a role. This is where assessment analytics overlaps with applied machine learning, but the models are only as good as the features derived from clean process data.
-
Hybrid validation. The strongest implementations run psychometric checks and machine learning inference side by side, not as a replacement for one another. A predictive model might flag a candidate as high-risk for early attrition, but that flag should be checked against IRT-based ability estimates and subgroup fairness analysis before it drives a real decision. The PMC research frames this combination, CTT or IRT for calibration, sequence models for temporally structured tasks, supervised models for prediction, as the practical path forward, always anchored to a validity argument rather than treated as a standalone black box.
None of these methods substitutes for the others. Descriptive dashboards catch operational problems, psychometric models establish measurement rigor, and sequence or predictive models add depth that traditional scoring misses entirely.
Building a Practical Data Quality Assessment Workflow
Analytics built on bad data produces confident-sounding conclusions that are simply wrong, and process data is more fragile than final scores because it has more fields, more timestamps, and more places for a logging bug to quietly corrupt a session. A data quality assessment, or DQA, is the systematic methodology IBM describes for determining whether your data actually meets the bar required for its intended use, and it needs to run continuously, not as a one-time audit before a big report.
Five dimensions deserve regular monitoring:
- Accuracy: do logged values match what actually happened during the session?
- Completeness: are required fields, like item ID or timestamp, missing on any records?
- Timeliness: is data available quickly enough to support the decision it’s meant to inform?
- Consistency: do the same fields mean the same thing across item types, platforms, and cohorts?
- Uniqueness: are duplicate session records or repeated event logs inflating your counts?
A workable DQA cycle follows a consistent sequence: define the scope of what needs checking, profile the data to understand its current state, set explicit rules for what “good” looks like, automate the checks that enforce those rules, and document every rule change with a version number so you can trace when and why a metric shifted. The U.S. Geological Survey’s recommended practices for data quality review echo this exact rhythm: catch errors early with scheduled reviews, maintain metadata consistently, and run test datasets through your processing scripts before trusting them on live data.
Manual DQA does not scale once you’re capturing keystroke-level data across thousands of sessions. A structured machine learning framework for multidimensional data quality assessment proposes a modular pipeline, preprocessing, model training, progressive learning, and version tracking, that automates checks across accuracy, completeness, timeliness, and consistency simultaneously, reducing the manual effort that traditionally made DQA a once-a-quarter chore instead of a continuous practice.
Privacy has to sit inside the same workflow, not bolted on afterward. Collect only the process signals a specific analysis actually needs (data minimization), de-identify session records before they’re shared with anyone outside the core analytics team, and set retention policies that delete raw keystroke and clickstream logs once their evidentiary value has passed. Consent language should specifically disclose that process data, not just final scores, is being collected and analyzed.
Pro Tip: Version every DQA rule change the same way you version code. When a metric jumps 12% between reporting periods, the first question anyone will ask is whether the underlying rule changed, and you want a one-line answer, not a week of archaeology.
Validity and Fairness: When Process Data Becomes Real Evidence
A revision count or a hint-request log is not automatically meaningful. It becomes evidence only when it’s tied to a validity argument, a documented chain of reasoning connecting the observed behavior to the construct you’re actually trying to measure. The Springer chapter on assessment analytics foundations is direct about this: process data must be interpreted within a validity framework, or it’s just noise dressed up as insight.
Building that argument in practice usually involves a few concrete checks:
- Differential Item Functioning (DIF) analysis tests whether an item behaves differently for comparable subgroups, flagging items that may unfairly penalize test-takers based on language background, disability status, or device type rather than the skill being measured.
- Subgroup analyses compare process patterns, response times, revision behavior, across demographic or contextual groups to catch systematic differences that don’t reflect ability.
- Calibration checks confirm that predicted difficulty or ability estimates from IRT models hold up against actual observed performance on new samples.
- Triangulation cross-references process signals against outcome data and, where available, external criteria like subsequent job performance or course grades, to confirm a pattern isn’t an artifact of one measurement approach alone.
The line between evidence and proxy is where teams most often go wrong. A longer response time might genuinely indicate careful reasoning, or it might indicate a test-taker on a slow internet connection who’s waiting for a page to load. Without device metadata and a documented hypothesis, you cannot tell the difference, and treating an ambiguous signal as clean evidence is how bias creeps into supposedly objective analytics.
Limitations deserve equal weight in this conversation. Findings from a single cohort, a single item type, or a small pilot rarely generalize to a different population or platform. Ecological validity, whether behavior in a monitored test session matches how someone would actually perform in the real setting the test is meant to predict, is a persistent, largely unresolved challenge across the field. Any assessment analytics program that treats its early findings as final, rather than as hypotheses to keep testing against new data, is setting itself up for a fairness problem it won’t see coming.
Implementation Checklist: Instrument, Pipeline, QA, Operationalize
Most assessment analytics initiatives stall not because the analysis is too hard, but because the sequencing is wrong: teams start building dashboards before they’ve defined what decision the dashboard is supposed to support. A working implementation follows five ordered steps.
-
Define constructs, metrics, and decisions. Before instrumenting anything, write down the specific construct you’re measuring (reading fluency, SQL proficiency, coachability) and the exact decision the analytics will inform, such as flagging a candidate for a second-round interview or triggering a formative feedback message. Vague goals produce unusable data.
-
Instrument events and metadata consistently. Design an event schema up front, covering every process signal you plan to capture, response time, revision, click, hint request, and apply it uniformly across item types and platforms. Inconsistent logging between your web and mobile clients is one of the most common, and most avoidable, sources of downstream data quality failure.
-
Build ingestion and cleaning pipelines with versioning. Raw logs need a pipeline that timestamps, deduplicates, and structures events into a queryable format, with every transformation version tracked. A feature store, a central, versioned repository of derived metrics like average revision count per item, keeps engineering and analytics teams working from the same definitions instead of quietly diverging.
-
Run DQAs and psychometric checks before scaling. Pilot on a limited sample first. Confirm reliability with CTT or IRT calibration, run DIF checks on new items, and validate your DQA rules against a manually audited subset before rolling the pipeline out to a full cohort or applicant pool.
-
Deploy dashboards and close the loop on item design. Ship reporting templates that surface both outcome and process metrics to the people making decisions, then feed what you learn back into item revision. An item that shows unusually high revision counts across every subgroup might simply be worded ambiguously, not measuring anything meaningful about ability.
| Implementation stage | Primary output | Common failure if skipped |
|---|---|---|
| Define constructs and metrics | Documented decision the analytics supports | Dashboards nobody can act on |
| Instrument events consistently | Uniform event schema across platforms | Cross-platform data that can’t be compared |
| Build versioned pipelines | Clean, queryable, auditable dataset | Untraceable metric drift over time |
| Run DQA and psychometric checks | Validated reliability and fairness baseline | Biased or unreliable inferences at scale |
| Deploy dashboards, revise items | Closed feedback loop improving future items | Static item banks that never improve |
Where Assessment Analytics Shows Up in Practice
In classrooms, assessment analytics closes a loop that traditional grading leaves open. Formative feedback systems use response-time and revision patterns to flag students who guessed correctly but showed hesitation consistent with a shaky grasp of the underlying concept, prompting a targeted follow-up before the gap widens. Early-warning systems draw on the same process signals, alongside outcome data, to identify at-risk students weeks before a failing grade would otherwise surface, a use case the PMC research on assessment analytics highlights explicitly as one of the field’s clearest payoffs. Adaptive assessments, built on IRT-calibrated item banks, adjust question difficulty in real time based on ongoing performance, shortening test time without losing measurement precision. Curriculum teams use aggregated item-level analytics to spot which specific concepts consistently produce high revision counts or long response times across cohorts, a signal that the material, not the students, needs revision.
In hiring, the same logic applies to candidate evaluation instead of student learning. How a candidate approaches a coding challenge, whether they test edge cases early, how they revise after an initial attempt, often reveals more about job-relevant capability than whether the final submission passed every test case. Process-level signals can inform ranking decisions and support high-stakes hiring by giving reviewers evidence beyond a pass or fail flag, though that evidence still needs validation and bias checks before it drives a decision, the same standard that applies to any psychometric instrument used in employment contexts. Vendor platforms in the K-12 space, like Renaissance Assessment, illustrate how screening, progress monitoring, and formative assessment can be productized into a single system that surfaces next-step recommendations for educators, a pattern that translates directly to how structured process analytics get operationalized in hiring platforms too.
How Talent Approved Puts Assessment Analytics Into Practice
The implementation checklist above describes what any organization needs to build. Talent Approved’s platform is built around executing that same sequence for hiring teams specifically, without requiring an in-house psychometrician on staff.
Magic Create addresses the construct-definition step directly: input a job description or a list of desired skills, and the system generates a role-specific, structured assessment in minutes rather than the days a manually built test bank usually takes. That speed matters, but the more important part is consistency: every generated assessment follows a standardized template, which is exactly the uniform instrumentation the implementation checklist calls for.
Built-in anti-cheat mechanisms, including screen and webcam monitoring, tackle a data quality problem specific to remote assessment: without integrity checks, you cannot trust that the process data you’re capturing reflects the candidate’s own work. Session replay gives reviewers direct access to the process data itself, how a candidate navigated a task, where they hesitated, what they revised, turning abstract process signals into something a hiring manager can actually watch and interpret.
AI-generated summaries compress that process and outcome data into a reviewable format, reducing the time reviewers spend manually parsing session logs while preserving the evidentiary detail underneath. That’s the “deploy dashboards” step from the implementation workflow, adapted for a hiring context where the end user is a busy recruiter, not a data analyst.
Together, these features map onto the checklist’s stages:
- Instrumentation: standardized, role-specific test generation via Magic Create
- Data integrity: anti-cheat monitoring during the assessment session
- Interpretation: session replay and candidate rankings for reviewers
- Reporting: AI-generated summaries that operationalize the analytics for non-technical decision-makers
Teams evaluating how automated summaries translate raw assessment behavior into hiring-ready insight can see the mechanics explained further in how instant assessments convert process data into recruiter summaries.
Quick Wins and Common Pitfalls in Assessment Analytics Projects
Teams tend to fail in the same three places. The first is mis-specifying the construct before instrumenting anything, building an elaborate process-data pipeline around a skill nobody clearly defined, which produces rich data that answers the wrong question. The second is treating data quality as an afterthought, trusting clickstream logs that were never profiled or version-controlled, until a stakeholder asks why last quarter’s numbers don’t match this quarter’s and nobody can explain the drift. The third, and most damaging, is skipping pilot validation entirely: deploying a predictive model or a new scoring rubric straight to production because the pilot felt like an unnecessary delay, only to discover a fairness problem after it’s already shaped real decisions.
The wins that offset these risks don’t require a big budget. Start logging timestamps and revision counts on your next assessment cycle, even before you have a model that uses them; you can’t retrofit history. Run a lightweight DIF check on your highest-stakes item set this sprint, comparing performance across whatever subgroups your sample size supports. And document one validity argument, in plain language, for the single metric your team relies on most, so anyone questioning it later has something concrete to review rather than a black box.
If there’s one place to start, it’s construct definition. Every downstream problem in assessment analytics traces back to a construct that was never clearly written down, and fixing that costs an afternoon, not a quarter.
— Jimmie
Put Assessment Analytics to Work With Talent Approved
Building the pipeline described above from scratch, event schemas, DQA automation, psychometric calibration, takes real engineering time most HR teams don’t have to spare. Talent Approved compresses that entire workflow into a platform where Magic Create builds a role-specific assessment from a job description in minutes, anti-cheat monitoring protects the integrity of the process data you collect, and AI-generated summaries turn session replays into a reviewable decision in the time it takes to read one page.
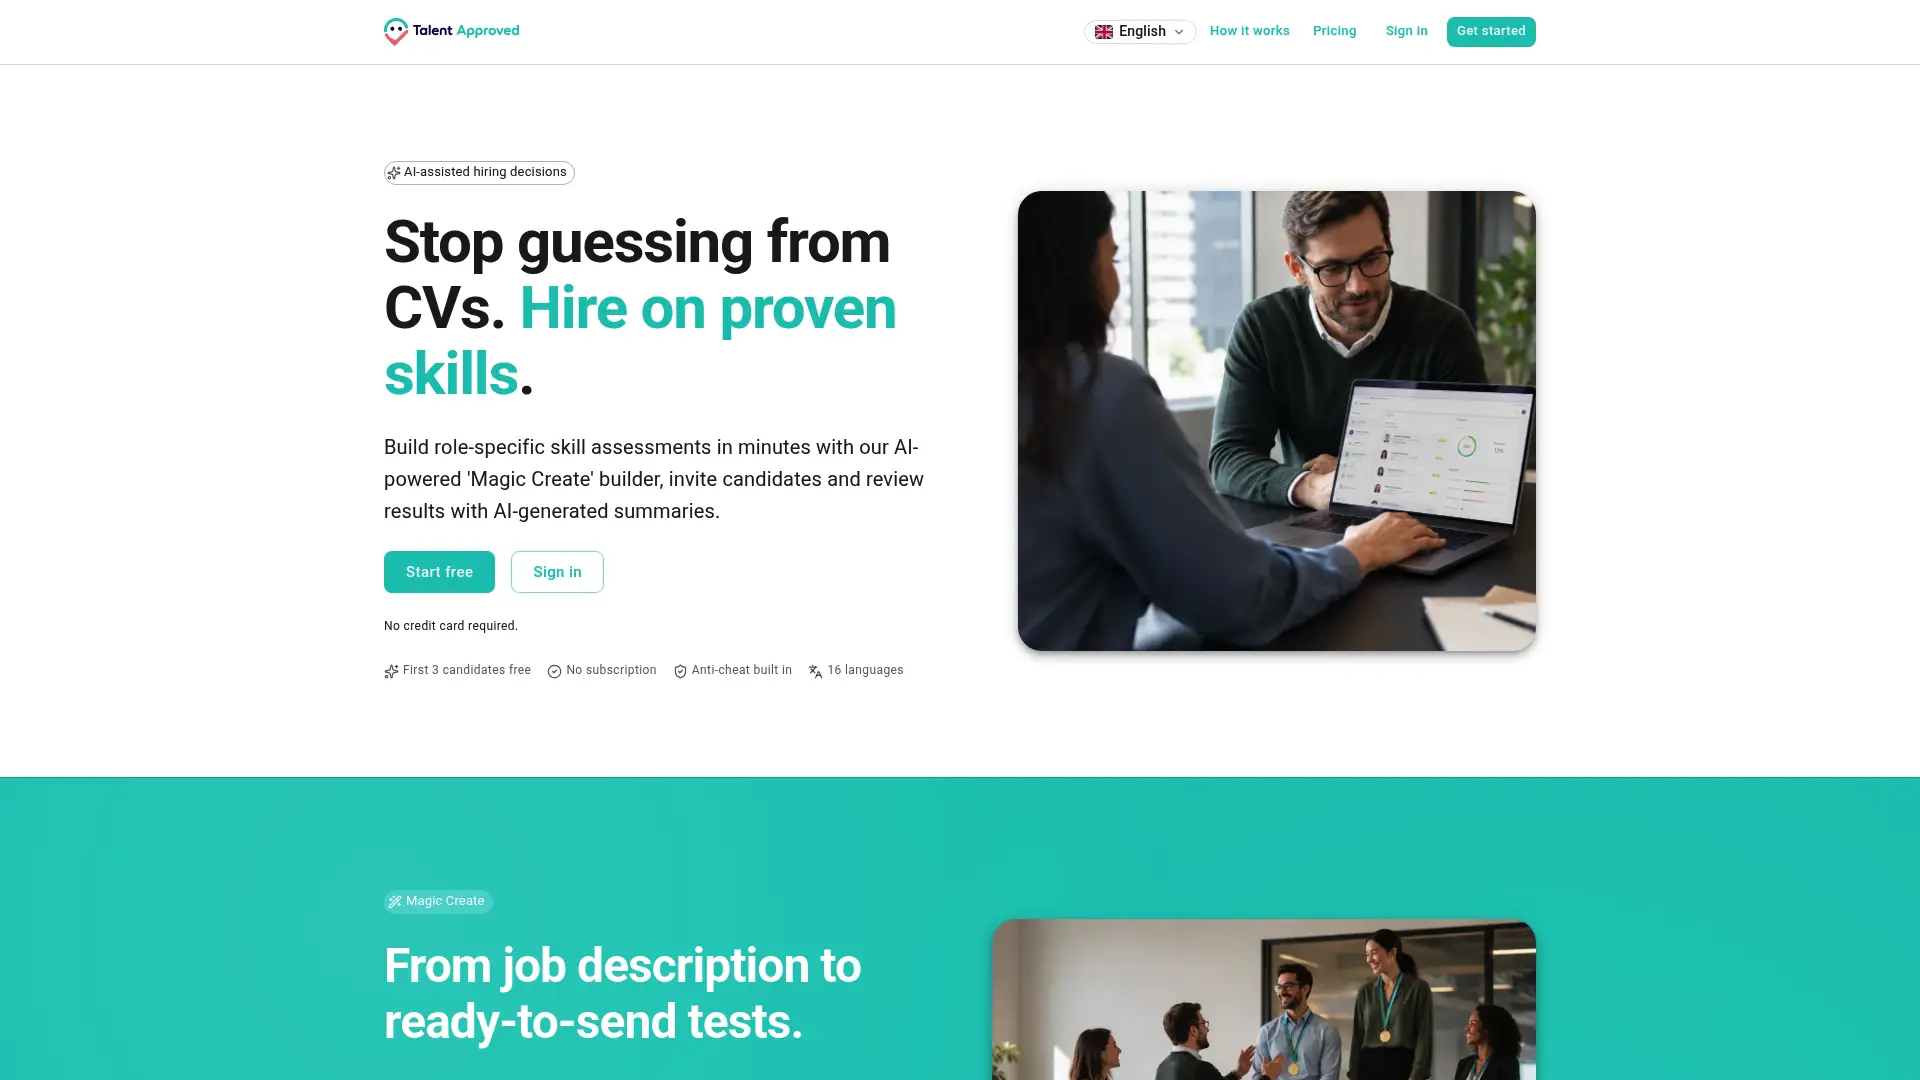
For a hiring team weighing the cost of a per-candidate assessment against building an internal analytics stack, the math tends to favor starting with a pilot rather than a build. Run a handful of real requisitions through the platform, compare the candidate rankings and summaries against how your current process performs, and treat the results the way this guide recommends treating any new assessment method: validate before you scale. Visit the Talent Approved platform to start a pilot on your next open role and see what candidate process data reveals that a resume never could.
Sources
For readers who want to go deeper into the methods and standards referenced throughout this guide, these sources cover the technical foundations in more detail than a single article can:
- Assessment Analytics in Digital Assessments
- Assessment analytics: The missing step
- What Is a Data Quality Assessment? | IBM
Readers building or refining hiring assessments specifically may also find value in how assessment templates scale consistently across roles, and in broader industry context on AI’s role in hiring efficiency.
FAQ
What is an example of an assessment tool that uses assessment analytics?
Adaptive testing platforms built on Item Response Theory are a clear example, adjusting item difficulty in real time based on a test-taker’s responses. Hiring platforms that generate role-specific tests and layer in session replay and anti-cheat monitoring, such as Talent Approved, apply the same principle to candidate evaluation.
What are the different types of assessments used in HR?
HR assessments generally fall into skills tests (role-specific technical or cognitive tasks), personality and behavioral assessments, situational judgment tests, and structured interviews scored against a rubric. Process-level analytics, like response time and revision patterns during a skills test, can add evidence layered on top of any of these formats.
What is the difference between assessment, analysis, and evaluation?
Assessment is the act of gathering data about performance or ability; analysis is the statistical or computational process of examining that data for patterns; evaluation is the judgment made afterward about whether an outcome meets a standard. Assessment analytics sits between the first two, systematically analyzing assessment-generated data to strengthen the evidence evaluation relies on.
What counts as assessment data?
Assessment data includes both outcome data (item responses, scores, subscores) and process data (response times, revision counts, clickstreams, keystrokes, hint requests), along with metadata like timestamps and item IDs that make the other two layers usable for analysis.